先决条件: 支持向量机
null
让我们创建一个 线性核支持向量机 使用Python的sklearn库和 虹膜数据集 可以在Python的数据集库中找到。
线性核 当数据是线性可分离的,也就是说,它可以用一行来分离时使用。它是最常用的内核之一。它主要用于特定数据集中有大量特征的情况。其中一个有很多特性的例子是 文本分类 ,因为每个字母表都是一个新功能。因此,我们在文本分类中主要使用线性核。
笔记 :运行以下代码时,Internet连接必须稳定,因为它涉及下载数据。 ![图片[1]-在Python中创建线性核SVM-yiteyi-C++库](https://www.yiteyi.com/wp-content/uploads/geeks/geeks_gfglinear.png)
在上图中,有两组功能“ 蓝色 “功能和功能” 黄的 “特征。因为它们很容易分离,或者换句话说,它们是线性可分离的,所以这里可以使用线性核。
优势 使用线性核的方法:
1.使用线性核训练支持向量机 更快 比任何其他内核都好。
2.当使用线性核训练支持向量机时,只需优化 C.正规化 参数是必需的。另一方面,当使用其他内核进行训练时,需要优化 γ 参数,这意味着执行网格搜索通常需要更多时间。
# Import the Libraries import numpy as np import matplotlib.pyplot as plt from sklearn import svm, datasets # Import some Data from the iris Data Set iris = datasets.load_iris() # Take only the first two features of Data. # To avoid the slicing, Two-Dim Dataset can be used X = iris.data[:, : 2 ] y = iris.target # C is the SVM regularization parameter C = 1.0 # Create an Instance of SVM and Fit out the data. # Data is not scaled so as to be able to plot the support vectors svc = svm.SVC(kernel = 'linear' , C = 1 ).fit(X, y) # create a mesh to plot x_min, x_max = X[:, 0 ]. min () - 1 , X[:, 0 ]. max () + 1 y_min, y_max = X[:, 1 ]. min () - 1 , X[:, 1 ]. max () + 1 h = (x_max / x_min) / 100 xx, yy = np.meshgrid(np.arange(x_min, x_max, h), np.arange(y_min, y_max, h)) # Plot the data for Proper Visual Representation plt.subplot( 1 , 1 , 1 ) # Predict the result by giving Data to the model Z = svc.predict(np.c_[xx.ravel(), yy.ravel()]) Z = Z.reshape(xx.shape) plt.contourf(xx, yy, Z, cmap = plt.cm.Paired, alpha = 0.8 ) plt.scatter(X[:, 0 ], X[:, 1 ], c = y, cmap = plt.cm.Paired) plt.xlabel( 'Sepal length' ) plt.ylabel( 'Sepal width' ) plt.xlim(xx. min (), xx. max ()) plt.title( 'SVC with linear kernel' ) # Output the Plot plt.show() |
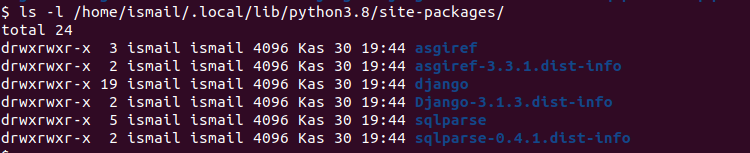
输出: ![图片[2]-在Python中创建线性核SVM-yiteyi-C++库](https://www.yiteyi.com/wp-content/uploads/geeks/geeks_Capture-112.png) 在这里,所有的特征用简单的线分开,因此代表线性内核。
在这里,所有的特征用简单的线分开,因此代表线性内核。
© 版权声明
文章版权归作者所有,未经允许请勿转载。
THE END

![关于”PostgreSQL错误:关系[表]不存在“问题的原因和解决方案-yiteyi-C++库](https://www.yiteyi.com/wp-content/themes/zibll/img/thumbnail.svg)